Corey Rice


Hello! My name is Corey Rice. I'm a Grand Valley State University Graduate looking to work in Data Analytics. I have been working in Python with data specifically for 3 years now.
I have also worked with a large range of languages including, Java, SQL, Javascript, Swift, and HTML/CSS. Here are some of my past responsibilities at other companies listed below.
- Executed high-volume data processing tasks with meticulous attention to detail, ensuring accuracy and legality of financial transactions.
- Adapted quickly to evolving legal regulations and changing systems, demonstrating agility and problem-solving skills in a fast-paced environment.
- Collaborated effectively with cross-functional teams and senior management to facilitate smooth operations and address complex data-related challenges.
- Collaborated effectively with cross-functional teams and senior management to facilitate smooth operations and address complex data-related challenges.
- Collaborated with a team of colleagues on the development of large-scale websites, fostering effective teamwork and contributing to the successful delivery of client projects.
- Exhibited a proactive and adaptable mindset, eagerly embracing new technologies and tools to stay up-to-date with the latest industry trends and deliver innovative solutions to clients.
- Effectively communicated with senior executives and decision-makers from prominent companies, both through email and face-to-face meetings.”

- Led a senior capstone project where a group messaging and event mapping application was developed.
-Collaborated with a team of developers and assumed project lead responsibilities, overseeing the successful implementation of features using Swift programming.
-Integrated geolocation services to enable users to search for and join gatherings based on their interests and proximity.
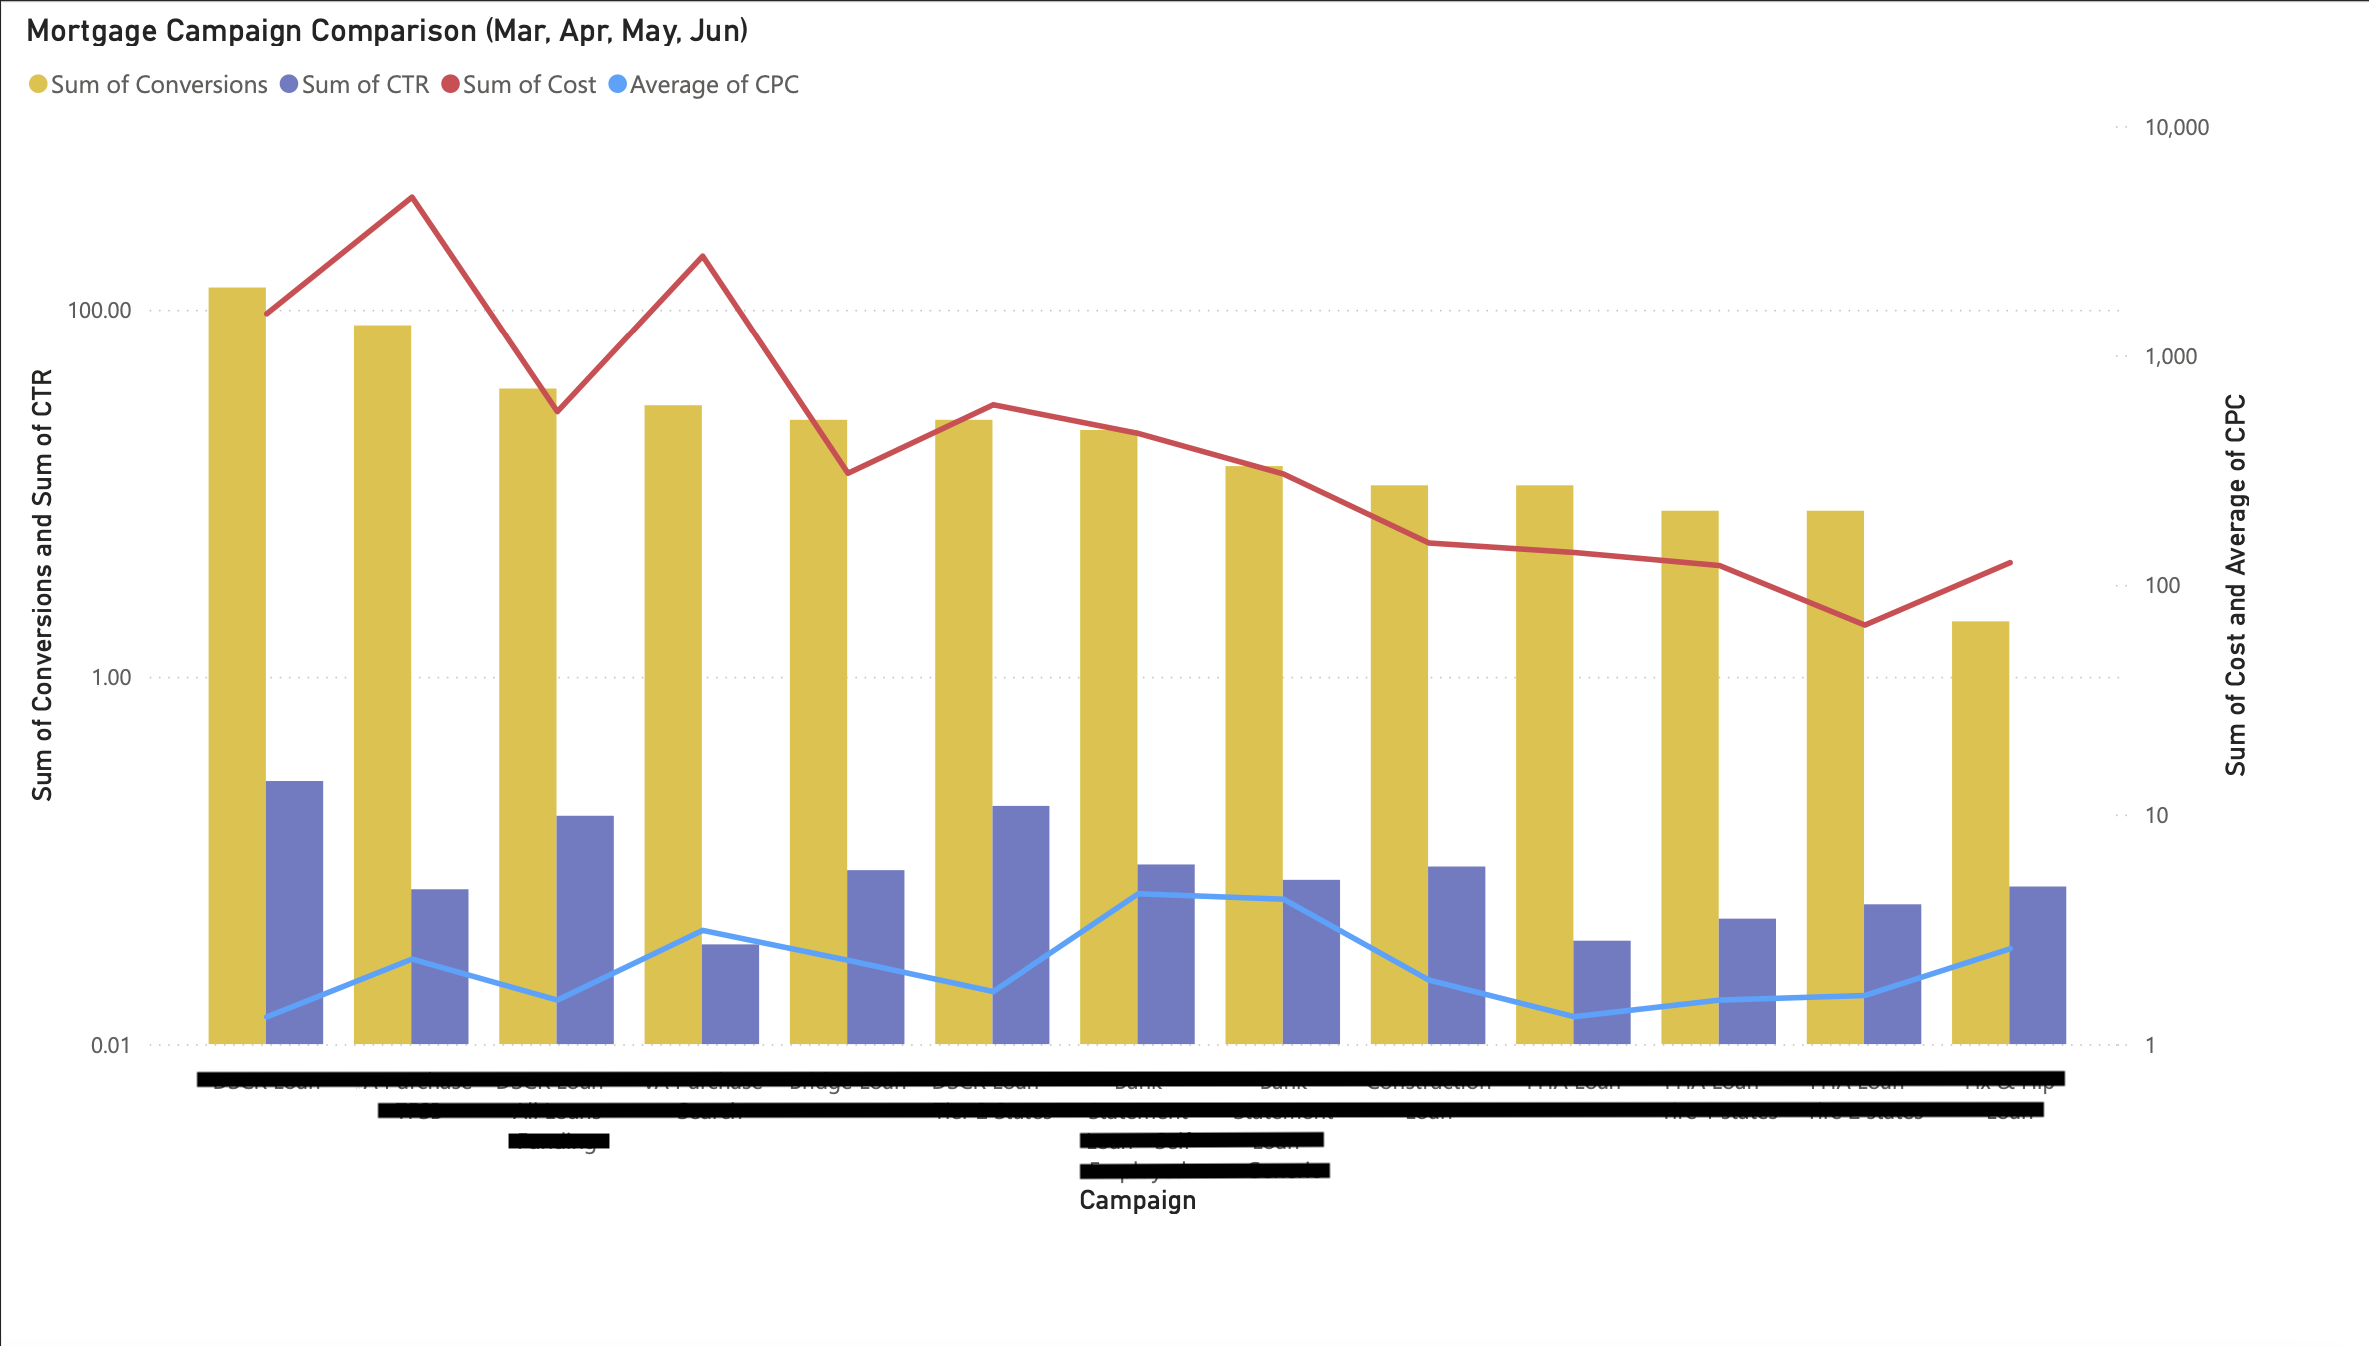
- Pulled web traffic data from Google Analytics processed that data into a SQL Server.
- Visualized that data with Power BI to present to the client to show which campaign that we ran was most successful and why.

- Developed and implemented a comprehensive data organization solution using Python scripts to efficiently manage and analyze large-scale datasets.
- Created visually appealing graphs and visualizations to present complex data patterns and trends.
*Code block below is just the logic for a multi-million entry data set
                import numpy as np
                import pandas as pd
                import sklearn as sk
                names = ['preg', 'plas', 'pres', 'skin', 'test', 'mass', 'pedi', 'age', 'class']
                dataFile = pd.read_csv (r'/Users/coreyrice/Desktop/Datamining/pima-indians-diabetes.csv', names = names)
                from sklearn import metrics
                from numpy import where
                from numpy import unique
                from sklearn.datasets import make_classification
                from matplotlib import pyplot as plt
                from sklearn.neural_network import MLPClassifier
                from sklearn.model_selection import cross_val_score
                from sklearn.preprocessing import StandardScaler
                from sklearn.cluster import KMeans
                import warnings
                warnings.filterwarnings("ignore")
                stdScaler = StandardScaler()

                #Set up x and y
                X = dataFile[['preg', 'plas', 'pres', 'skin', 'test', 'mass', 'pedi', 'age']]
                Y = dataFile['class']
                SScaled = stdScaler.fit_transform(X)
                nn = MLPClassifier(solver='lbfgs', alpha=1e-5, hidden_layer_sizes=(5,2), random_state=1)
                nn.fit(X,Y)

                print("Unscaled Data")

                scores = cross_val_score(nn, X, Y, cv=5, scoring='accuracy')
                print(scores.mean())
                scores = cross_val_score(nn, X, Y, cv=5, scoring='recall')
                print(scores.mean())
                scores = cross_val_score(nn, X, Y, cv=5, scoring='precision')
                print(scores.mean())
                scores = cross_val_score(nn, X, Y, cv=5, scoring='f1_macro')
                print(scores.mean())

                print("Scaled Data")
                scores = cross_val_score(nn, SScaled, Y, cv=5, scoring='accuracy')
                print(scores.mean())
                scores = cross_val_score(nn, SScaled, Y, cv=5, scoring='recall')
                print(scores.mean())
                scores = cross_val_score(nn, SScaled, Y, cv=5, scoring='precision')
                print(scores.mean())
                scores = cross_val_score(nn, SScaled, Y, cv=5, scoring='f1_macro')
                print(scores.mean())

                x, y = make_classification(n_samples=1000, n_features=2, n_informative=2, n_redundant=0,
                                        n_clusters_per_class=1, random_state=4)
                model = KMeans(n_clusters=2)
                yhat = model.fit_predict(x)
                clusters = unique(yhat)
                for cluster in clusters:
                    row_ix = where(yhat == cluster)
                    plt.scatter(x[row_ix, 0], x[row_ix,1])

                plt.show()
- Designed and executed a C project that simulated message communication across multiple servers.
- Configured and optimized server configurations to achieve seamless and reliable message transmission.
                /* Server.c code - Corey Rice*/
                #include
                #include
                #include
                #include
                #include
                #include
                #include

                void error(char *msg)
                {
                    perror(msg);
                    exit(1);
                }

                int main(int argc, char *argv[])
                {
                    int sockfd, newsockfd, portno, clilen;
                    char buffer[1002];
                    struct sockaddr_in serv_addr, cli_addr;
                    int n;

                    if (argc < 2) {
                        fprintf(stderr,"ERROR, no port provided\n");
                        exit(1);
                    }
                    sockfd = socket(AF_INET, SOCK_STREAM, 0);

                    if (sockfd < 0)
                        error("ERROR opening socket");

                    bzero((char *) &serv_addr, sizeof(serv_addr));
                    portno = atoi(argv[1]);
                    serv_addr.sin_family = AF_INET;
                    serv_addr.sin_addr.s_addr = INADDR_ANY;
                    serv_addr.sin_port = htons(portno);

                    if (bind(sockfd, (struct sockaddr *) &serv_addr, sizeof(serv_addr)) < 0){
                        error("ERROR on binding");
                    }

                    listen(sockfd,5);
                    clilen = sizeof(cli_addr);
                    newsockfd = accept(sockfd, (struct sockaddr *) &cli_addr, &clilen);

                    if (newsockfd < 0){
                        error("ERROR on accept");
                    }

                    while(1){
                        bzero(buffer,1002);
                        n = read(newsockfd,buffer,1001);

                        if (n < 0) {
                            error("ERROR reading from socket");
                        }
                        printf("Here is the message: %s\n",buffer);
                        printf("Enter your message: \n");
                        char reply[1002];
                        fgets(reply, 1001, stdin);
                        n = write(newsockfd, reply, strlen(reply));

                        if (n < 0){
                            error("ERROR writing to socket");
                        }
                    }
                    return 0;

                }
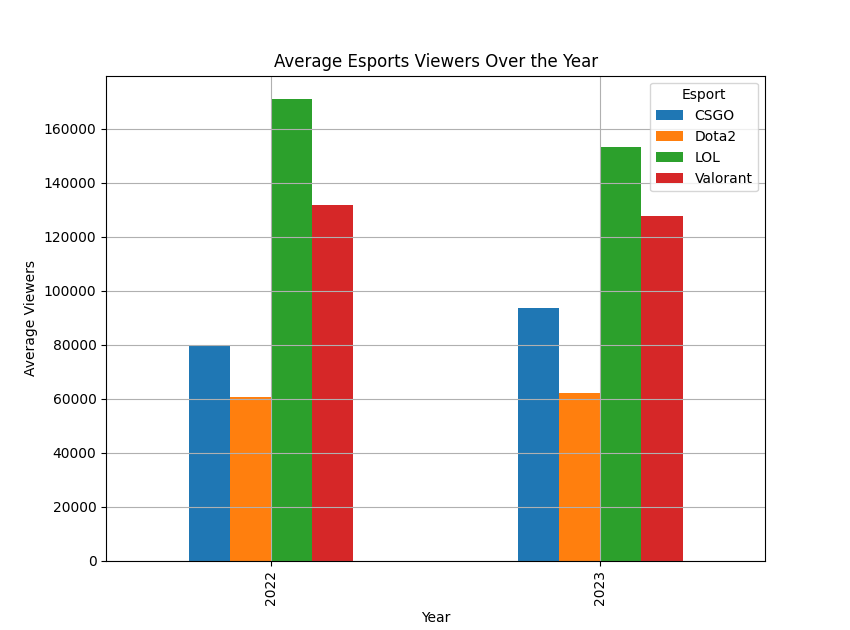
- Processed and integrated esports viewership data from diverse CSV files using Pandas for effective analysis.
- Visualized trends in average and peak viewership for multiple esports titles over a two-year period using Matplotlib.

- I have coded this website from scratch using HTML, CSS, Javascript, and Flask python for testing.
Since 2014, I've been deeply immersed in the dynamic world of esports, passionately following a diverse array of competitive titles including Halo, Counter-Strike, Dota 2, and Valorant. My journey in esports extends beyond mere spectatorship; I've actively participated in tournaments for Counter-Strike, Halo, and Melee, experiencing firsthand the adrenaline-fueled intensity of competitive gaming. Among these, my allegiance lies prominently with Counter-Strike, where I've devoted significant time and effort, both following and contributing to the scene. Firmly believing that esports represents the future of entertainment, I've witnessed the exponential growth in viewership numbers and financial investments within the industry, affirming its status as the next big phenomenon. Fueling my passion further, I've engaged in several data projects centered around esports, exploring its intricacies and potential. In the ever-evolving landscape of competitive gaming, I find myself continuously inspired and captivated by its limitless possibilities.

My competitive spirit extends beyond the digital realm into the gritty world of combat sports. My journey in this arena began with wrestling and evolved into the art of Muay Thai, where discipline and determination are paramount. Immersed in the pulse-pounding action, I avidly follow The UFC and One Championship, drawn to the raw intensity and skill displayed by the fighters. Attending a One Championship event in Denver, Colorado, was a highlight, witnessing firsthand the unparalleled mastery in the striking realm. The relentless pursuit of victory and championship belts by fighters resonates deeply with me, mirroring the same level of drive and dedication I bring to my daily endeavors. Every day on the training mats and in the gym, I push myself to new heights, inspired by the relentless work ethic of fighters like Israel Adesanya and Jonathan Haggerty. Their tenacity fuels my own, shaping me both as an athlete and as an individual driven by passion and purpose.

